Free tool shows London data like never before
Local London launched a free new tool on 17 August 2022 that presents the most up-to-date population and place data in an easy-to-understand visual format for the first time.
The Data Warehouse, which has been developed in-house by Local London, has been designed to be easy to use by non-data experts and people working with data alike.
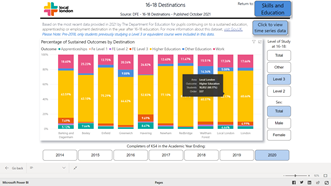
Recognising that many people find graphs easier to understand and interpret than tables of numbers, Local London’s Data Warehouse makes use of new software to present data in user-friendly charts and maps.
Through interactive dashboards, data can be viewed on demographics and community, jobs and employment, skills, business and economy, green economy and transport, at borough level, London and national level. In another first, the ‘Local London Overview’ dashboard enables comparisons by showing key data at sub-regional level too.
Sarah Murray, Director of Local London said “This huge treasure trove of data is easy to understand and explore. This is a powerful aid for people working in public and private and voluntary sector to inform their research and planning, as well as people who want to understand how their borough or region compares.
Huge thanks and congratulations to our small in-house team and colleagues from the University of East London who have created this fabulous asset that will support our work, and that of our local council members and partners for years to come.”
Up-to-date, trusted data for everyone
The dashboards pull together public data from a range of trusted sources and are updated whenever new figures are available, so users are always accessing the most recent, published data.
Whether looking at business data comparing the region to the capital average, air quality data, or what percentage of 16-18 year olds opt to go into further education / work the data is presented in colourful graphs with explanations that mean that data can be used by a wide audience.

The top of each data dashboard explains what the data is, what it measures, the data source and the most recent data publication date. There is a helpful user guide on the data warehouse home page, and a contact button if you have any queries. To make it even easier to use, Local London will be running free, on-line training sessions over the next six weeks until the end of September.
Find out more
To find out more about the free training sessions, or to receive email updates when new data is published in the Warehouse, please email Local.London.Data@redbridge.gov.uk
⇒ Explore the Data Warehouse
The data warehouse has been developed by Local London Data Scientist, Sophie Lingfield, in Microsoft Power BI software with support from University of East London.