Free data tool gets bigger and better
Understanding statistics about north east and south east London just got easier and more comprehensive.
Relaunched this week, the Local London data warehouse has been updated and now incorporates datasets covering our nine boroughs, which includes our newest member, London Borough of Bromley.
In addition to providing the latest information across our entire sub-region and easy-to-understand comparisons with London and England averages, the warehouse now includes:
- Updates to our core datasets including population, business demography, and benefit claimants – which now allows for comparison from 2017 up to 2023
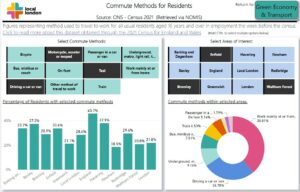
New datasets from 2021 Census on:
- Main spoken language
- Commute Transport Methods
Pulling together the most up-to-date public data from trusted sources, the data warehouse presents the information in a way that is easy to understand, for experts and people who do not work with data on a regular basis.
With information on topics such as population, skills, employment, ethnicity and much more, it is a useful tool for policy makers, researchers, campaign planners and anyone interested in understanding our sub-region.
Sarah Murray, Director of Local London said “I am thrilled that the Local London Data Warehouse is now even more comprehensive and includes figures for all nine of our member boroughs. At the touch of a button, anyone can see current and historic data from our boroughs on a range of topics as well as making comparisons with the wider London region and national picture – it’s easy and free. This is really useful for researchers, planners, people working in policy or campaigns, or anyone seeking to understand the borough or sub-region better.”
Data discovery webinar
Join our free online webinar on Thursday 20 April 2-3pm for a guided tour of the datasets with the creator of the data warehouse.
The tour is open to anyone interested in learning how to make the most of the data. Book now to:
- Learn about the data available.
- Discover comparisons and how to interpret them.
- Hear examples of how this data can be applied to inform your work, campaigns and reports.
- Ask questions and find out how to make the most of this online tool to help you understand our sub-region.
⇒ Reserve your place for the webinar tour on Thursday 20 April 2-3pm on Eventbrite.
⇒ Explore the Data Warehouse